Hi everyone, welcome to my new, shiny, quarto-based web-site.
Before that, I was using Jekyll, as recommended by the github pages documentation. However, Jekyll is really overkill for a simple academic website (and a simpleton like myself). I tried different things, and ended up using this template, but I found it difficult to adapt to my needs (and it’s not maintained anymore).
Long story short: I have just switched to quarto, and I am very glad I did. I manage to do more advanced things (like adding a blog) in much less time.
Also, math support is great: \(2+\int_0^1 f(x) dx\). You can also type code:
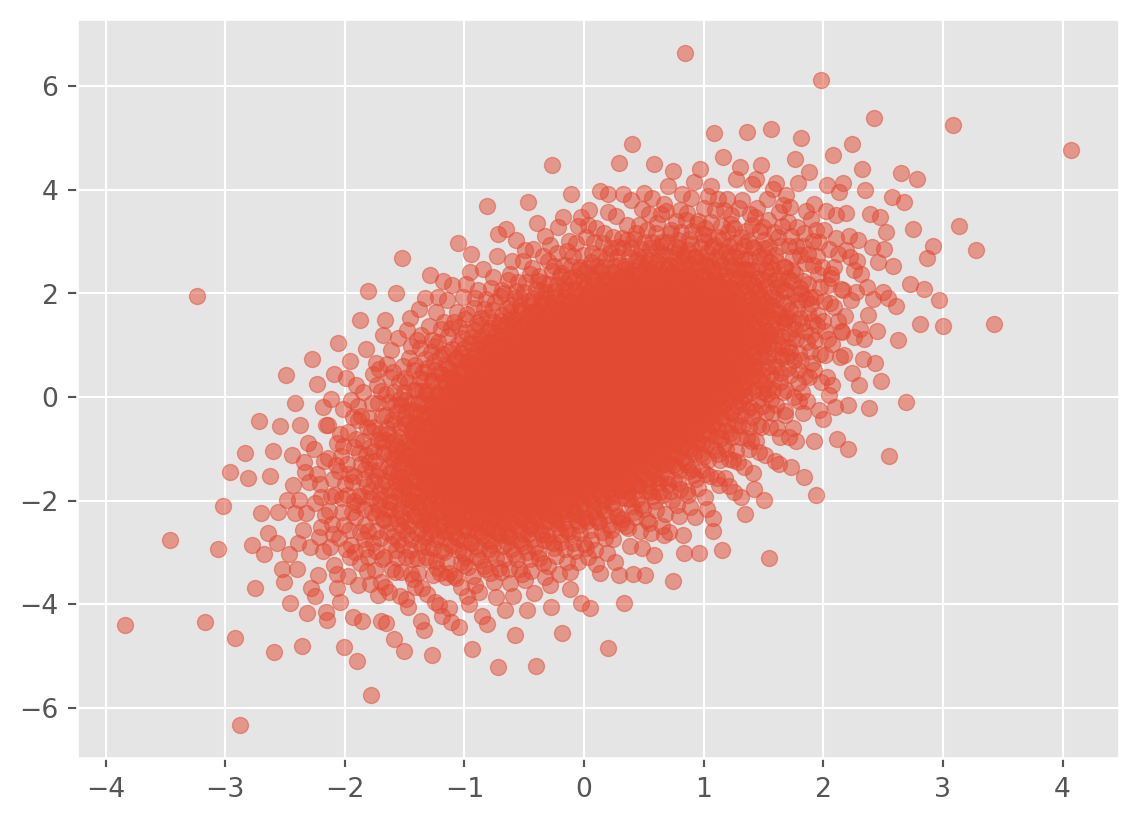
from matplotlib import pyplot as pltimport numpy as npfrom scipy import statssob = stats.qmc.Sobol(2)u = sob.random(4096) # must be a power of 2z = stats.norm.ppf(u)x = zrho =0.9x[:, 1] += rho * z[:, 0] + np.sqrt(1.- rho**2) * z[:, 1]plt.figure()plt.style.use('ggplot')plt.scatter(x[:, 0], x[:, 1], alpha=0.5)plt.show()